Datasets Insights
In this part of my project, I would like find out how all European union counties have managed Covid in analysed period of time by comparing total number of Covid cases and deaths per 10,000 population with countries own characteristics.
Dataset Insights: Datasets Insights
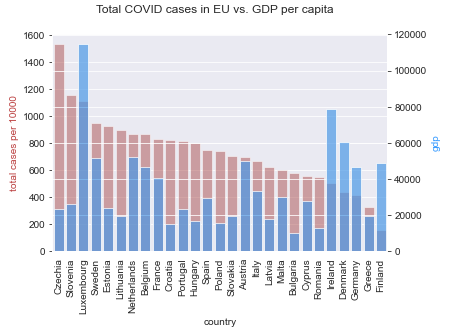
Total Covid cases vs GDP per capita
First of all, I wanted to check if there is correlation between number of cases in each country and their GDP per capita. In this investigation I haven’t noticed any obvious visual correlations. The only thing that is noticeable is 4 out of 5 the richest counties with highest GDP per capita ( please see Economical Dataset analysis) Ireland, Denmark, Finland has the total lowest number of COVID cases.
Total Covid deaths vs Median Age
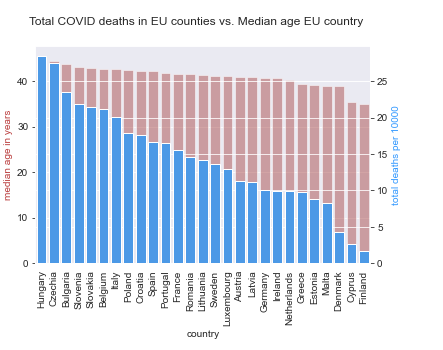
In this pair of features you can notice not definite but noticeable relation. Number of Covid deaths is slightly falling as falling the median age of population in the country. Countries with higher median age experienced higher number of Covid cases in total.
Total Covid deaths vs Number of days in the highest school closure restriction
On this chart I can see that countries with number of days higher than average in school lockdown have experienced high number of deaths (Czechia, Slovenia, Slovakia). On the other side of chart there are countries like Latvia, Germany, Ireland, Greece, Malta with also high number of school closed days but less than average deaths. I will look into those counties in final chart, as those group of countries might have more things in common.
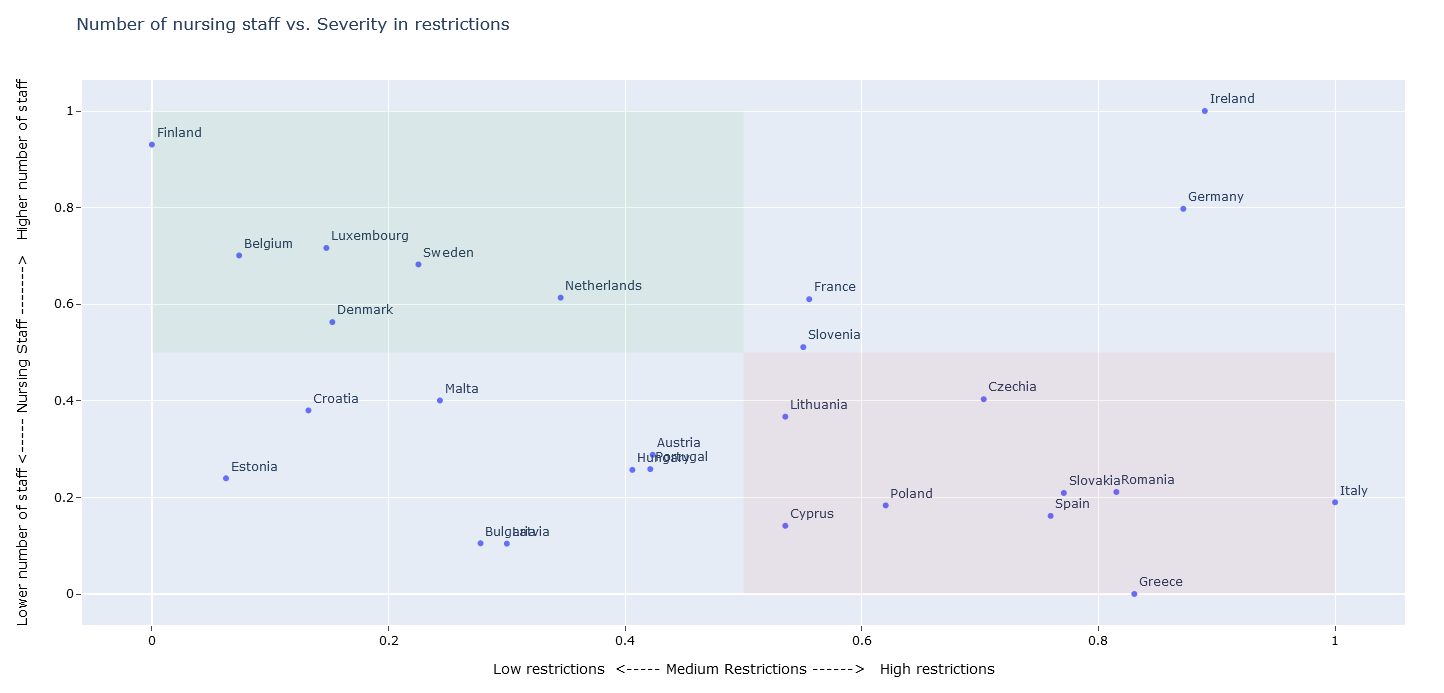
Number of Nursing staff vs Severity in restrictions with normalized data
On this chart there is visible relation between number of nursing staff and number of days in school/ internal movement lockdown. You can see that countries with high level of staffing have experienced lower level of restriction as number of nurses is falling countries implemented longer and more server lockdown. There is one more interesting fact that I have noticed that when I taking into account GDP per capita, wealthy countries Ireland, Germany , Finland , Luxembourg have high number of staff.
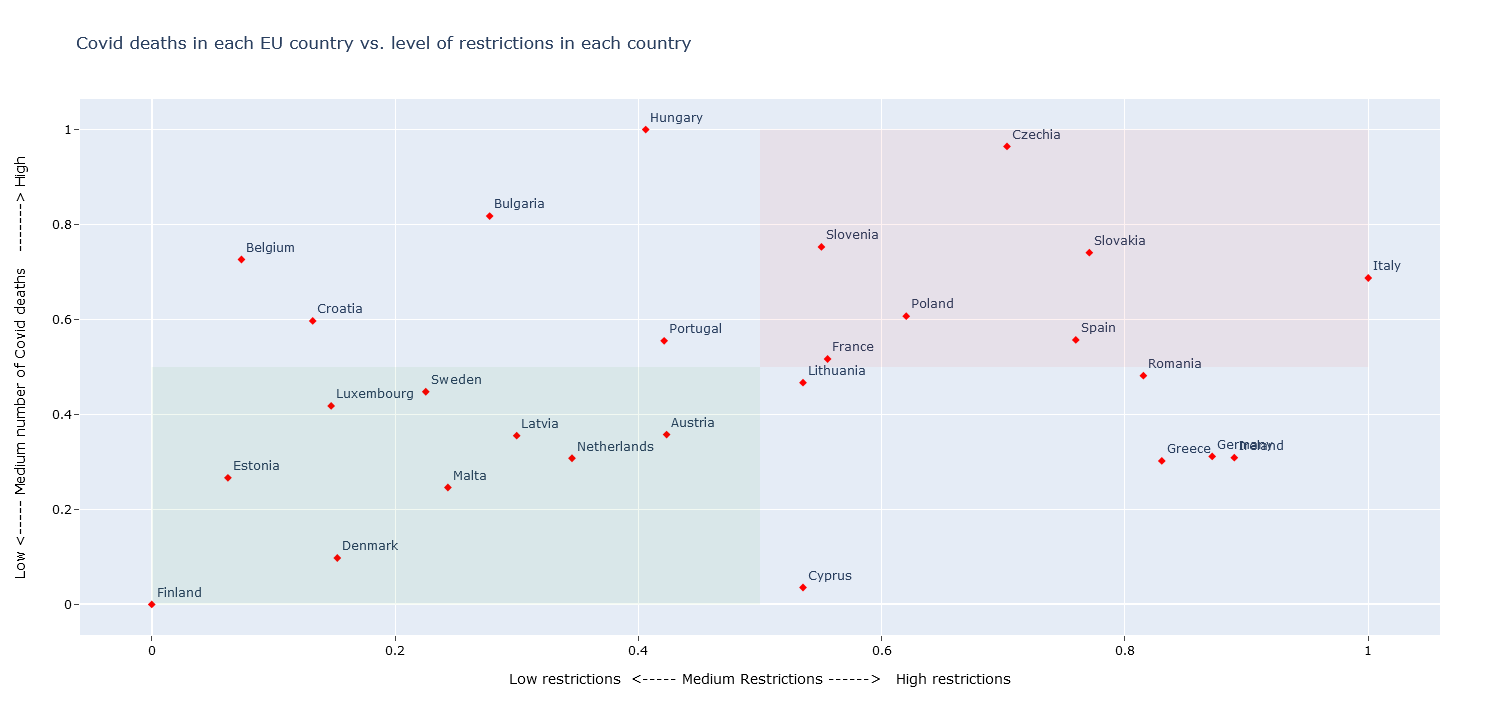
Total Covid deaths vs Number of days in the highest internal movement and school closure restriction with normalized data
In this chart I compared new number of deaths with number of days in both internal movement restriction and school closures. Again, the worst situation can be observed in eastern European countries even though they had longer /higher level of restrictions. On the other hand, we have Finland, Denmark, Malta, Estonia. Even though they had no restrictions they had low number of deaths. Ireland, German and Greece kept their restriction for longer and that helped them to keep number of deaths lower than average in EU.
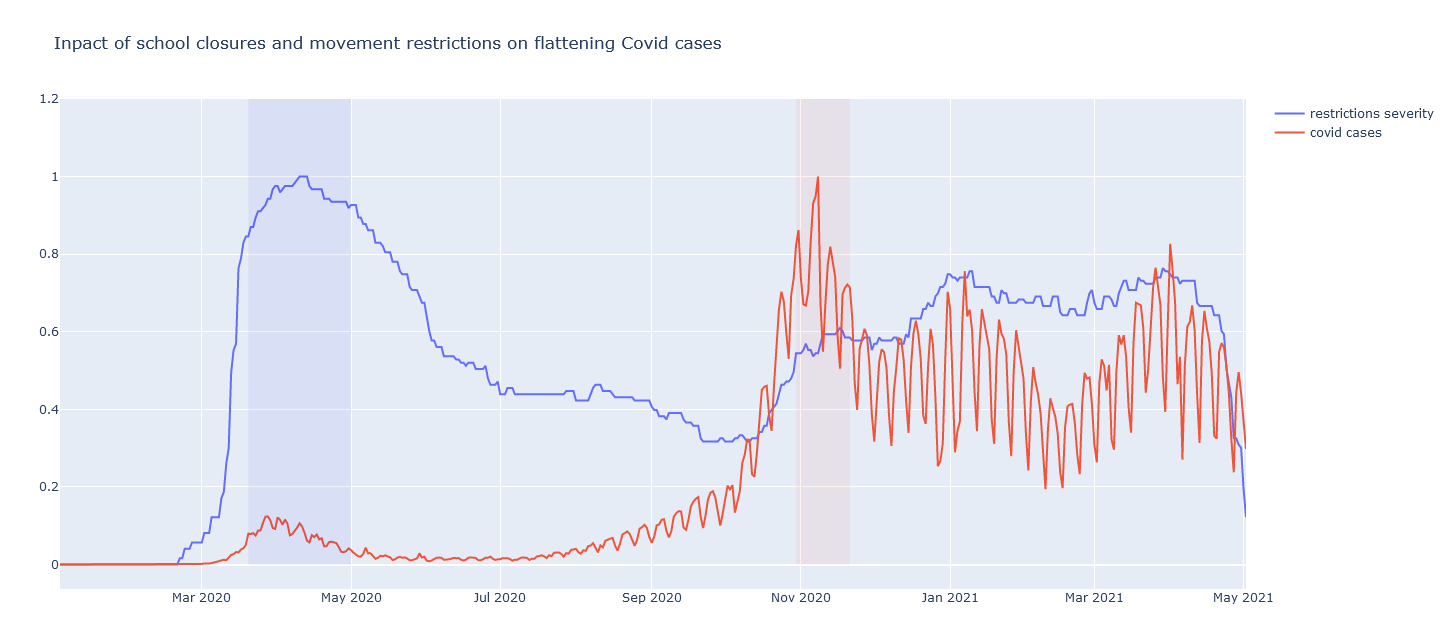
Daily Covid cases vs. school closures and movement restrictions.
I am continuing analysing impact of policies on course of Covid cases through out the whole period of pandemic. Covid was a new disease, so as precaution all European countries closed schools and restricted internal movements, even though there was a very low number of new Covid cases. Europe have started extreme lockdown. This can be observed between March 2020 and May 2020. As we were learning more about Covid and reporting low number of cases, all EU started ceasing on restrictions. You can see that particularly between July-Sept 2020. The next turning point happened in October/November 2020, Covid cases started dramatically increase. Countries decided to introduce lockdowns again, however in less strict conditions. Prolonged period of lockdown at the start of pandemic, probably has put counties in economic trouble and also politicians started to encounter society resistance on severe lockdown. From January 2021 up to the current date the number of cases remained quite high with higher level of restrictions. Only in April /May 2021 countries have dropped restrictions as they strongly think that implementation of vaccination against Covid will suppress the disease.