Datasets Analysis
Dataset Economical Analysis
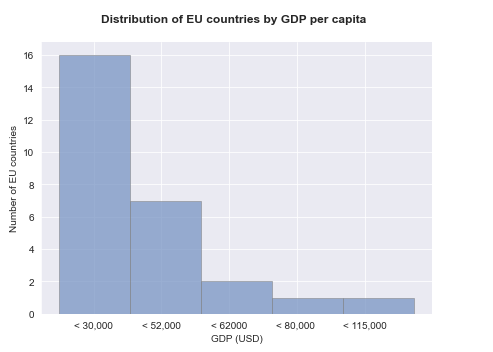
First task when preprocessing economical datasets was to remove non-EU countries, which was done with custom lambda function. Also, some country naming discrepancies were found (Czech Republic - Czechia). Some median age data was missing so dataframe had to be appended with relevant values. The whole cleaning process was finished with merging all datasets into one by country column. Visualizing dataset in a form of the bar chart give us some additional insights. You can easily observe that there are 16 countries where GDP range is between 10,000 and 30,000 USD/capita and 11 countries with GDP between 30,000 and 115,000 with much larger spread. When you also take for consideration the 75% centile , the amount (47614.01) is much lower that the max value and this shows that there are 2 high value outliers, Ireland and Luxembourg.
Dataset Cleaner: Cleaning Economical Dataset
Dataset Analysis: Economical Dataset Analysis
| population | GDP (USD per capita) | |
|---|---|---|
| count | 27 | 27 |
| mean | 16574520.04 | 35299.03555 |
| std | 22282343 | 23216.76212 |
| min | 502653 | 9828.148515 |
| 25% | 3427172 | 19424.40574 |
| 50% | 8877067 | 27858.371 |
| 75% | 14408452.5 | 47614.01879 |
| max | 83132799 | 114704.5942 |
Dataset Healthcare Analysis
After removing non-EU countries and standardising their names, next step was to keep only the recent data column as datasets contain data from year 1960. Null value gaps were filed with most recent non-null data from previous years. Once all three datasets were merged into one by country column, I got curious if there is simple linear correlation between country's GDP and a size of a healthcare sector. Common sense would be to say, that wealthy country has more doctors than the poor one. So, I did some analysis in that subject.
| physicians | nurses | hospital_beds | |
|---|---|---|---|
| count | 27.0 | 27.0 | 27.0 |
| mean | 3.59 | 8.46 | 4.99 |
| std | 0.8428894 | 3.2477669 | 1.7112389 |
| min | 1.9509 | 3.5534 | 2.21 |
| 25% | 3.0343 | 5.951499 | 3.335 |
| 50% | 3.4664 | 7.9665 | 4.69 |
| 75% | 4.01465 | 10.90885 | 6.59 |
| max | 5.4036 | 15.5735 | 8.0 |
| Top 5 Highest | Top 5 Lowest | ||||
|---|---|---|---|---|---|
| Physicians | Nurses | Beds | Physicians | Nurses | Beds |
| Greece | Ireland | Germany | Cyprus | Greece | Sweden |
| Austria | Finland | Bulgaria | Romania | Latvia | Denmark |
| Portugal | Germany | Austria | Poland | Bulgaria | Ireland |
| Lithuania | Luxembourg | Hungary | Malta | Cyprus | Spain |
| Germany | Belgium | Romania | Luxembourg | Spain | Italy |
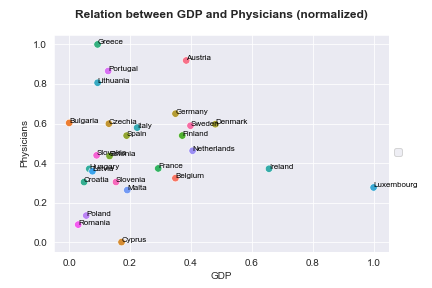
First step was to merge dataset with GDP column from economical dataset. Then I had to normalize the data to keep everything in range 0-1, where 1 is the top value and 0 is the lowest. This way it'll be easier for me to compare different value sizes. Once shown on the graph to the right, it's hard to say what top 10 countries have in common.
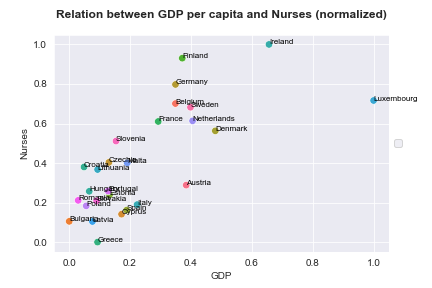
Much clearer situation is when it comes to nursing staff. Ireland takes the lead in Europe and generally, rich countries have more nurses than the poor ones. I think the main cause would be that the graduated nurses, often drastically underpaid are migrating for better job contracts.
Dataset Policies Analysis
Here is the most controversial part of my analysis. First task was to transform the dataset the way, that we could see the number of days per restriction level per country. In the future analysis I'll try to observe if there is any correlation between GDP and number of days in lockdown. Also, I'll try to measure how effective was each restriction and if it's quick application prevented case spikes.
Dataset Cleaner: Cleaning Policies Dataset
Dataset Analysis: Policies Dataset Analysis
| Number of days in each level of school closure restrictions | ||||
|---|---|---|---|---|
| Country | Level 0 No measures required |
Level 1 Recommended by government |
Level 2 Required at some levels |
Level 3 Required by government |
| Austria | 55 | 171 | 144 | 89 |
| Belgium | 53 | 267 | 127 | 21 |
| Bulgaria | 44 | 44 | 294 | 82 |
| Croatia | 52 | 179 | 175 | 59 |
| Cyprus | 52 | 55 | 268 | 86 |
| Czechia | 50 | 106 | 137 | 175 |
| Denmark | 71 | 101 | 193 | 95 |
| Estonia | 55 | 254 | 60 | 93 |
| Finland | 57 | 203 | 200 | 0 |
| France | 41 | 182 | 175 | 70 |
| Germany | 36 | 135 | 91 | 205 |
| Greece | 44 | 143 | 89 | 181 |
| Hungary | 50 | 70 | 226 | 120 |
| Ireland | 52 | 42 | 199 | 166 |
| Italy | 33 | 22 | 150 | 261 |
| Latvia | 52 | 24 | 199 | 192 |
| Lithuania | 52 | 72 | 248 | 96 |
| Luxembourg | 55 | 277 | 71 | 63 |
| Malta | 52 | 257 | 15 | 138 |
| Netherlands | 51 | 188 | 117 | 110 |
| Poland | 51 | 48 | 170 | 197 |
| Portugal | 48 | 150 | 141 | 128 |
| Romania | 50 | 0 | 217 | 201 |
| Slovakia | 49 | 33 | 212 | 168 |
| Slovenia | 55 | 141 | 107 | 159 |
| Spain | 48 | 169 | 134 | 108 |
| Sweden | 56 | 144 | 268 | 0 |
| Number of days in each level of internal movement restrictions | ||||
|---|---|---|---|---|
| Country | Level 0 No measures required |
Level 1 Recommended by government |
Level 2 Required at some levels |
|
| Austria | 193 | 138 | 144 | |
| Belgium | 367 | 12 | 127 | |
| Bulgaria | 415 | 0 | 294 | |
| Croatia | 402 | 0 | 175 | |
| Cyprus | 232 | 76 | 268 | |
| Czechia | 165 | 114 | 137 | |
| Denmark | 380 | 80 | 193 | |
| Estonia | 407 | 0 | 60 | |
| Finland | 386 | 50 | 200 | |
| France | 157 | 113 | 175 | |
| Germany | 98 | 106 | 91 | |
| Greece | 60 | 135 | 89 | |
| Hungary | 282 | 147 | 226 | |
| Ireland | 108 | 58 | 199 | |
| Italy | 173 | 0 | 150 | |
| Latvia | 467 | 0 | 199 | |
| Lithuania | 208 | 145 | 248 | |
| Luxembourg | 313 | 67 | 71 | |
| Malta | 331 | 21 | 15 | |
| Netherlands | 175 | 291 | 117 | |
| Poland | 195 | 206 | 170 | |
| Portugal | 271 | 90 | 141 | |
| Romania | 228 | 9 | 217 | |
| Slovakia | 125 | 171 | 212 | |
| Slovenia | 253 | 4 | 107 | |
| Spain | 61 | 104 | 134 | |
| Sweden | 224 | 244 | 268 | |